Forging Optimism from the Unknown
The Duality of Rollins Climate Research
The effects of climate change are palpable and can be observed through all five senses.
There are subtle standalone examples like the sight of pollen collecting on surfaces weeks earlier than normal, fluctuating growing seasons of the food we eat, and the smell of smoke from wildfires hundreds of miles away. There are also compounding examples like the roar of historic storms that leave entire regions without power and/or shelter, followed by heat waves that disproportionately affect large segments of the population.
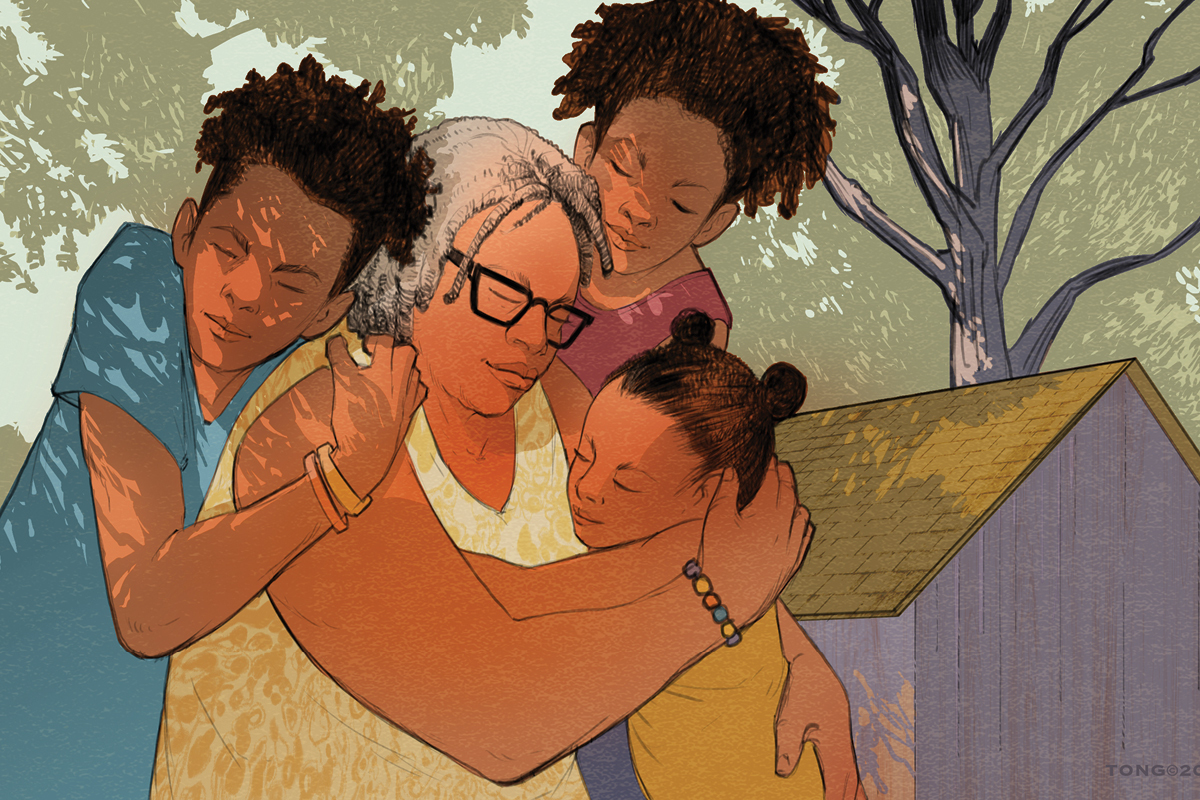
More alarming are the less tangible effects of climate change that research shows negatively impact health outcomes associated with conditions such as cancer, brain health, pulmonary disease, and kidney disorders. A recent study led by Howard Chang, PhD, professor of biostatistics and bioinformatics, showed heat waves jeopardize the health of babies before they are even born by increasing the risk of preterm and early-term labor.
The annual temperature increase globally is small—about .01 degree Celsius per year—but the threat this increase poses to public health is not.
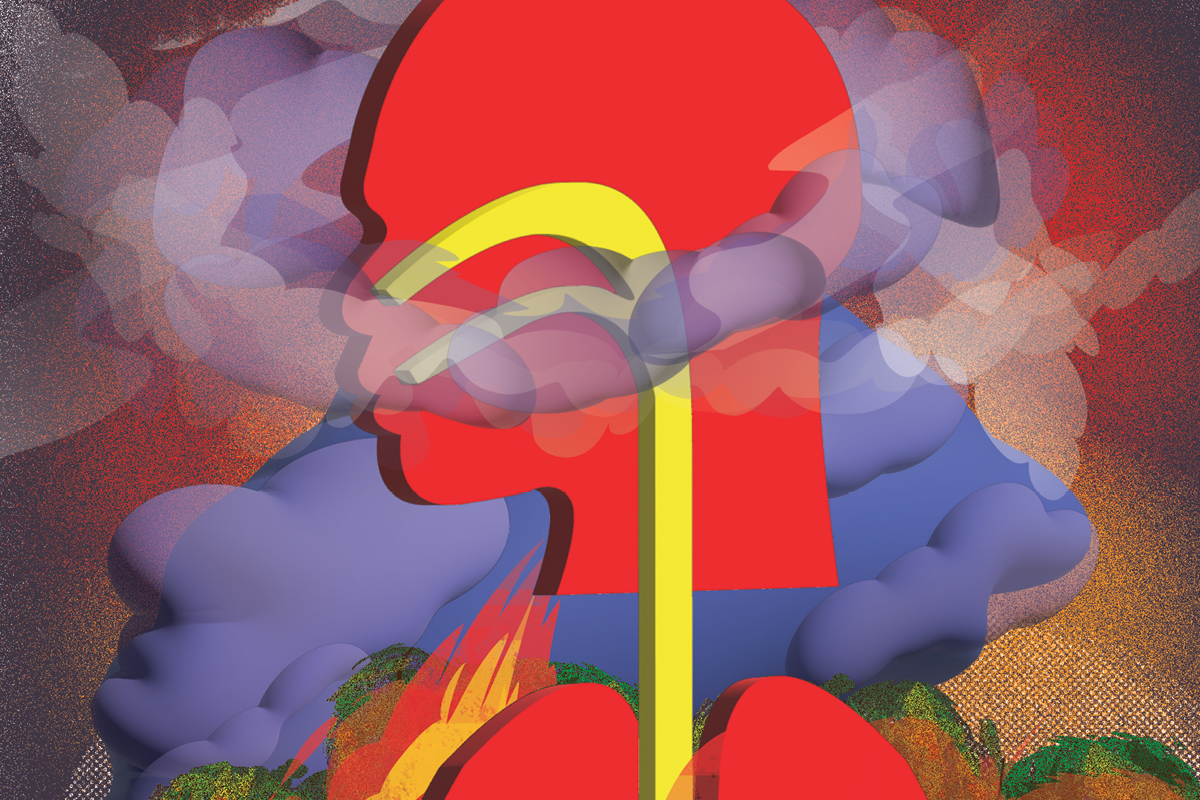
“I carry out my research with a sense of urgency, because the research tells me climate change is going to hit us badly,” says Yang Liu, PhD, Gangarosa Distinguished Professor and Chair of Environmental Health, who, within the last year, published a pair of studies showing proximity to wildfires is associated with decreased chances of survival for cancer patients and a surge in mental health-related emergency department visits. “If we don’t do anything, we are not going to go extinct, but a lot of people will suffer. And not just the very poor; it will be most people who suffer.”
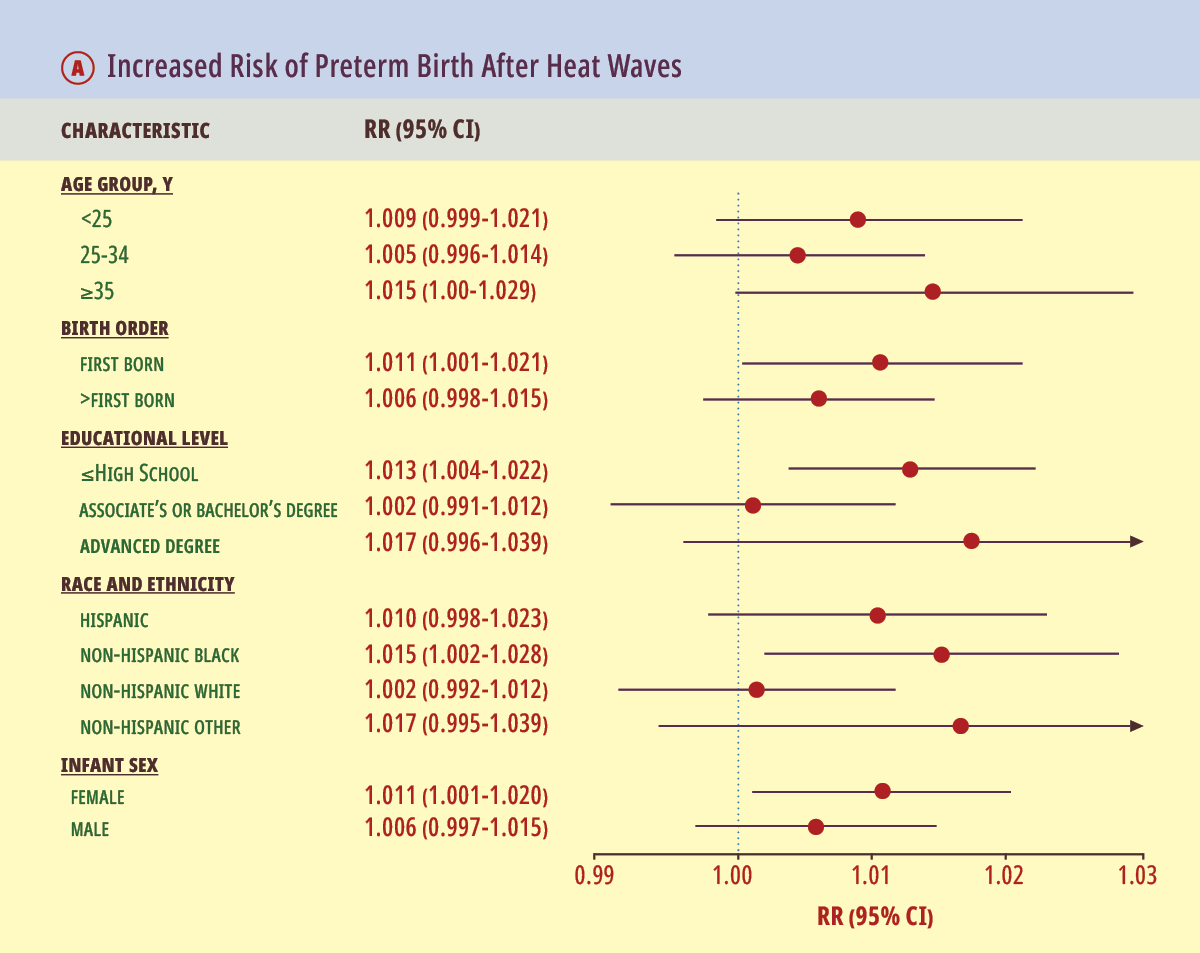
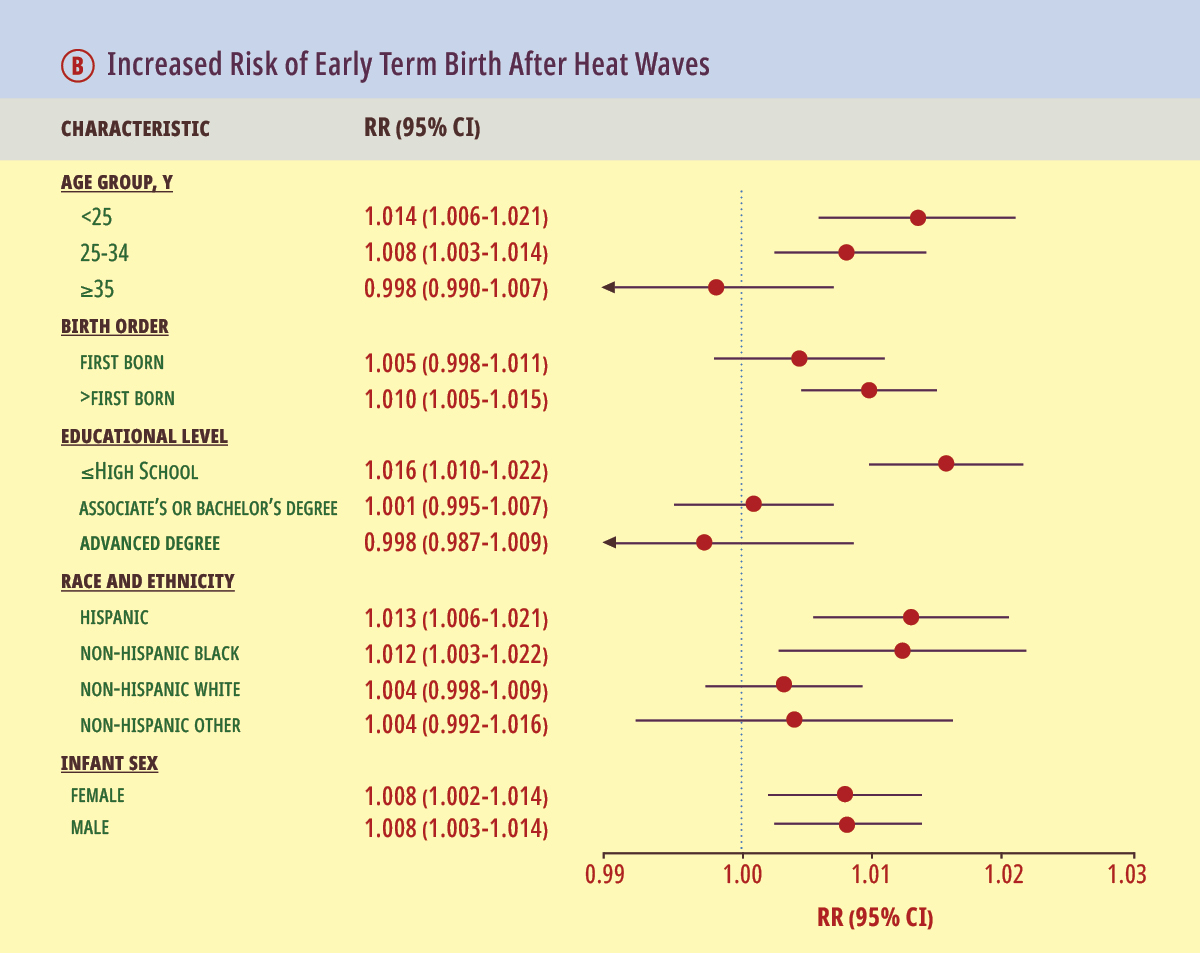
This illustration depicts the statistical area included in an analysis of 53 million births that occurred during the 25-year period from 1993-2017, which showed the rates of preterm and early-term births increased when local temperatures were abnormally hot for more than four consecutive days.
Citation: Darrow LA, Huang M, Warren JL, et al. Preterm and Early-Term Delivery After Heat Waves in 50 US Metropolitan Areas. JAMA Netw Open. 2024
The Unknown
Despite all the seen and unseen risks already associated with climate change, experts say we have not yet scratched the surface of understanding its impact on public health.
For example, an analysis by Rollins researchers of pollen data and emergency department visits over a 26-year period in metropolitan Atlanta found that while the number of emergency department visits related to asthma increased during this time, the risk of being hospitalized for pollen exposure had not. This comes despite an abundance of evidence suggesting the pollen season is starting earlier, lasting longer, and growing more intense due to global warming.
“Most of what I’ve learned through our research is how little is known about pollen and its associations with health,” says Noah Scovronick, PhD, assistant professor of environmental health. “The fact that there wasn’t a clear trend toward increased risk indicates to us that there are important factors beyond just the amount of exposure to pollen; there are probably a lot of human aspects to it. For example, what medications are available and who is taking them for asthma and other allergy-related diseases?”
While access to health care and various other interventions might help alleviate some pollen-related health burdens, Scovronick says not enough is known about who is most exposed, when they are exposed, and why. The same study, for instance, showed Black patients were nearly twice as likely to be hospitalized for allergic asthma as their white counterparts for several kinds of pollen.
“We don’t even know all the different types of diseases that pollen may affect,” Scovronick adds. “There’s an enormous amount that we don’t know and a huge range of questions that need to be investigated, because those answers are needed to directly inform the policies and interventions to protect people.”
Climate change is also occurring gradually, making it difficult to fully understand its impact on health.
“There is this mismatch in people’s perception of this global-scale phenomenon because we’re trying to perceive this tiny but inevitable change over a very long period. And linking the severity of specific extreme weather events to long-term trends and health outcomes is very difficult,” says Liu, who also serves as director of Rollins’ Climate & Health Actionable Research and Translation Center that studies climate risks facing under-resourced urban populations and develops strategies to help protect the health of these communities.
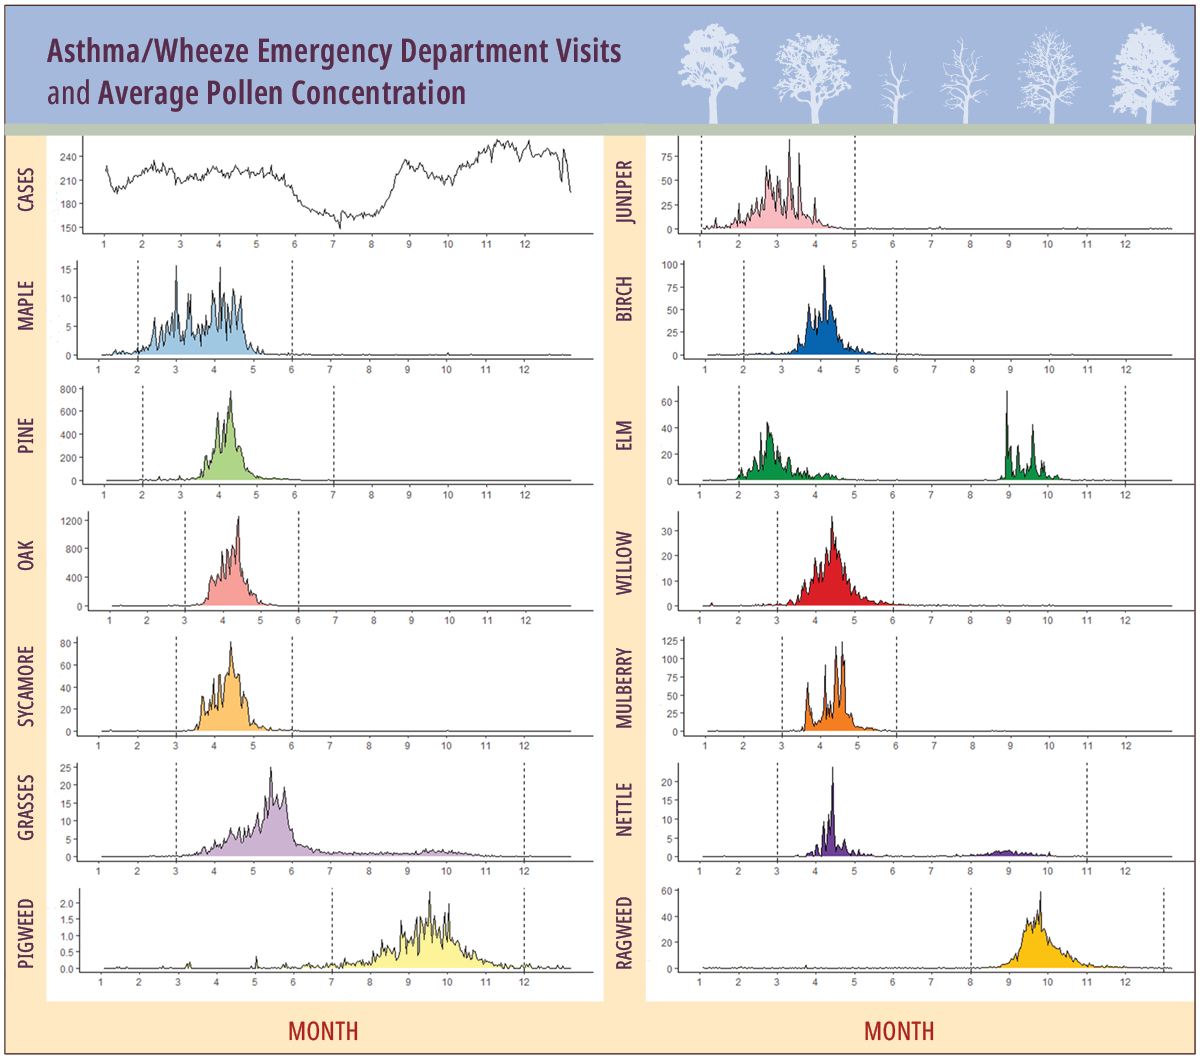
This data visualization shows day-of-year average asthma/wheeze emergency department visits and average pollen concentration (grains/m3) by pollen type in Atlanta over a 26-year study period. Dashed lines indicate the seasonal period included for each taxa-specific analysis.
Citation: Lappe BL, Ebelt S, D’Souza RR, Manangan A, Brown C, Saha S, Harris D, Chang HH, Sole A, Scovronick N. Pollen and asthma morbidity in Atlanta: A 26-year time-series study. Environ Int. 2023 Jul
Data with a Purpose
Despite Liu’s sense of urgency, there is also optimism.
“Now that it takes less effort to convince the public that climate change is real—because now everyone can see and feel it—it motivates me and gives me hope,” he says.
In July, Rollins provided another reason for this optimism when it launched the Climate and Health Indicator Dashboard for Georgia that provides data on the impact of climate change on human health across the state. The mobile-friendly dashboard provides data spanning decades on numerous indicators of climate-related hazards and trends for at-risk populations for each of Georgia’s 159 counties.
“This dashboard is a launchpad that we can keep improving, adding to, and that can give our research ideas a home beyond publishing them in journals and presenting them at academic conferences,” says Liu, adding the dashboard will also help disseminate data and findings from Rollins research. “It’s not just about the presentation of the data. It’s about the storytelling of these indicators, their time trends, and their spatial patterns, and the message this story can provide to the public, community groups, and decision-makers looking to affect positive change. This is a step forward for that.”
The interdisciplinary nature of the world-renowned climate research at Rollins provides an additional level of optimism for how the research that happens here can have global benefits for decades to come.
“Climate, as much or more than any public health topic, requires interdisciplinary and multidisciplinary approaches because it touches on so many different risk factors for poor health. So to have this multidimensional suite of researchers at Rollins allows us to get at the most important and complex questions,” Scovronick says. “We are ready to move beyond just understanding what the health impacts of climate change are. We are ready to move toward understanding how we can protect people from climate impacts, and how we can design policies that not only help us deal with climate change, but also can improve other aspects of public health simultaneously.”
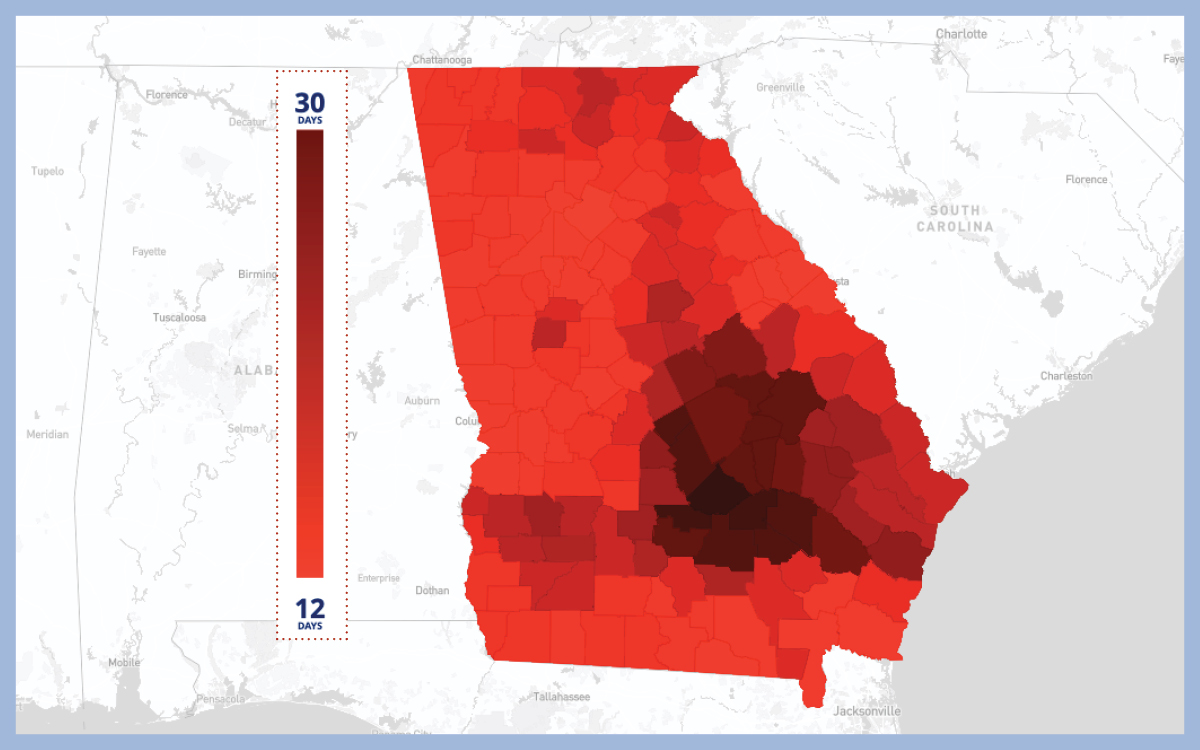
The new Climate and Health Indicator Dashboard for Georgia provides data on the impact that climate change is having on human health in the state. This map shows raw temperature data on a county level across Georgia. The annual number of extreme heat days are considered the number of days that exceeded a threshold using the 90th percentile of daily average temperatures from May to September during the years 1979 to 2019.
Citation: Rollins School of Public Health Climate and Health Indicator Dashboard
Visit the Climate and Health Indicator Dashboard for Georgia at climate.sph.emory.edu/dashboard